INNOVATION
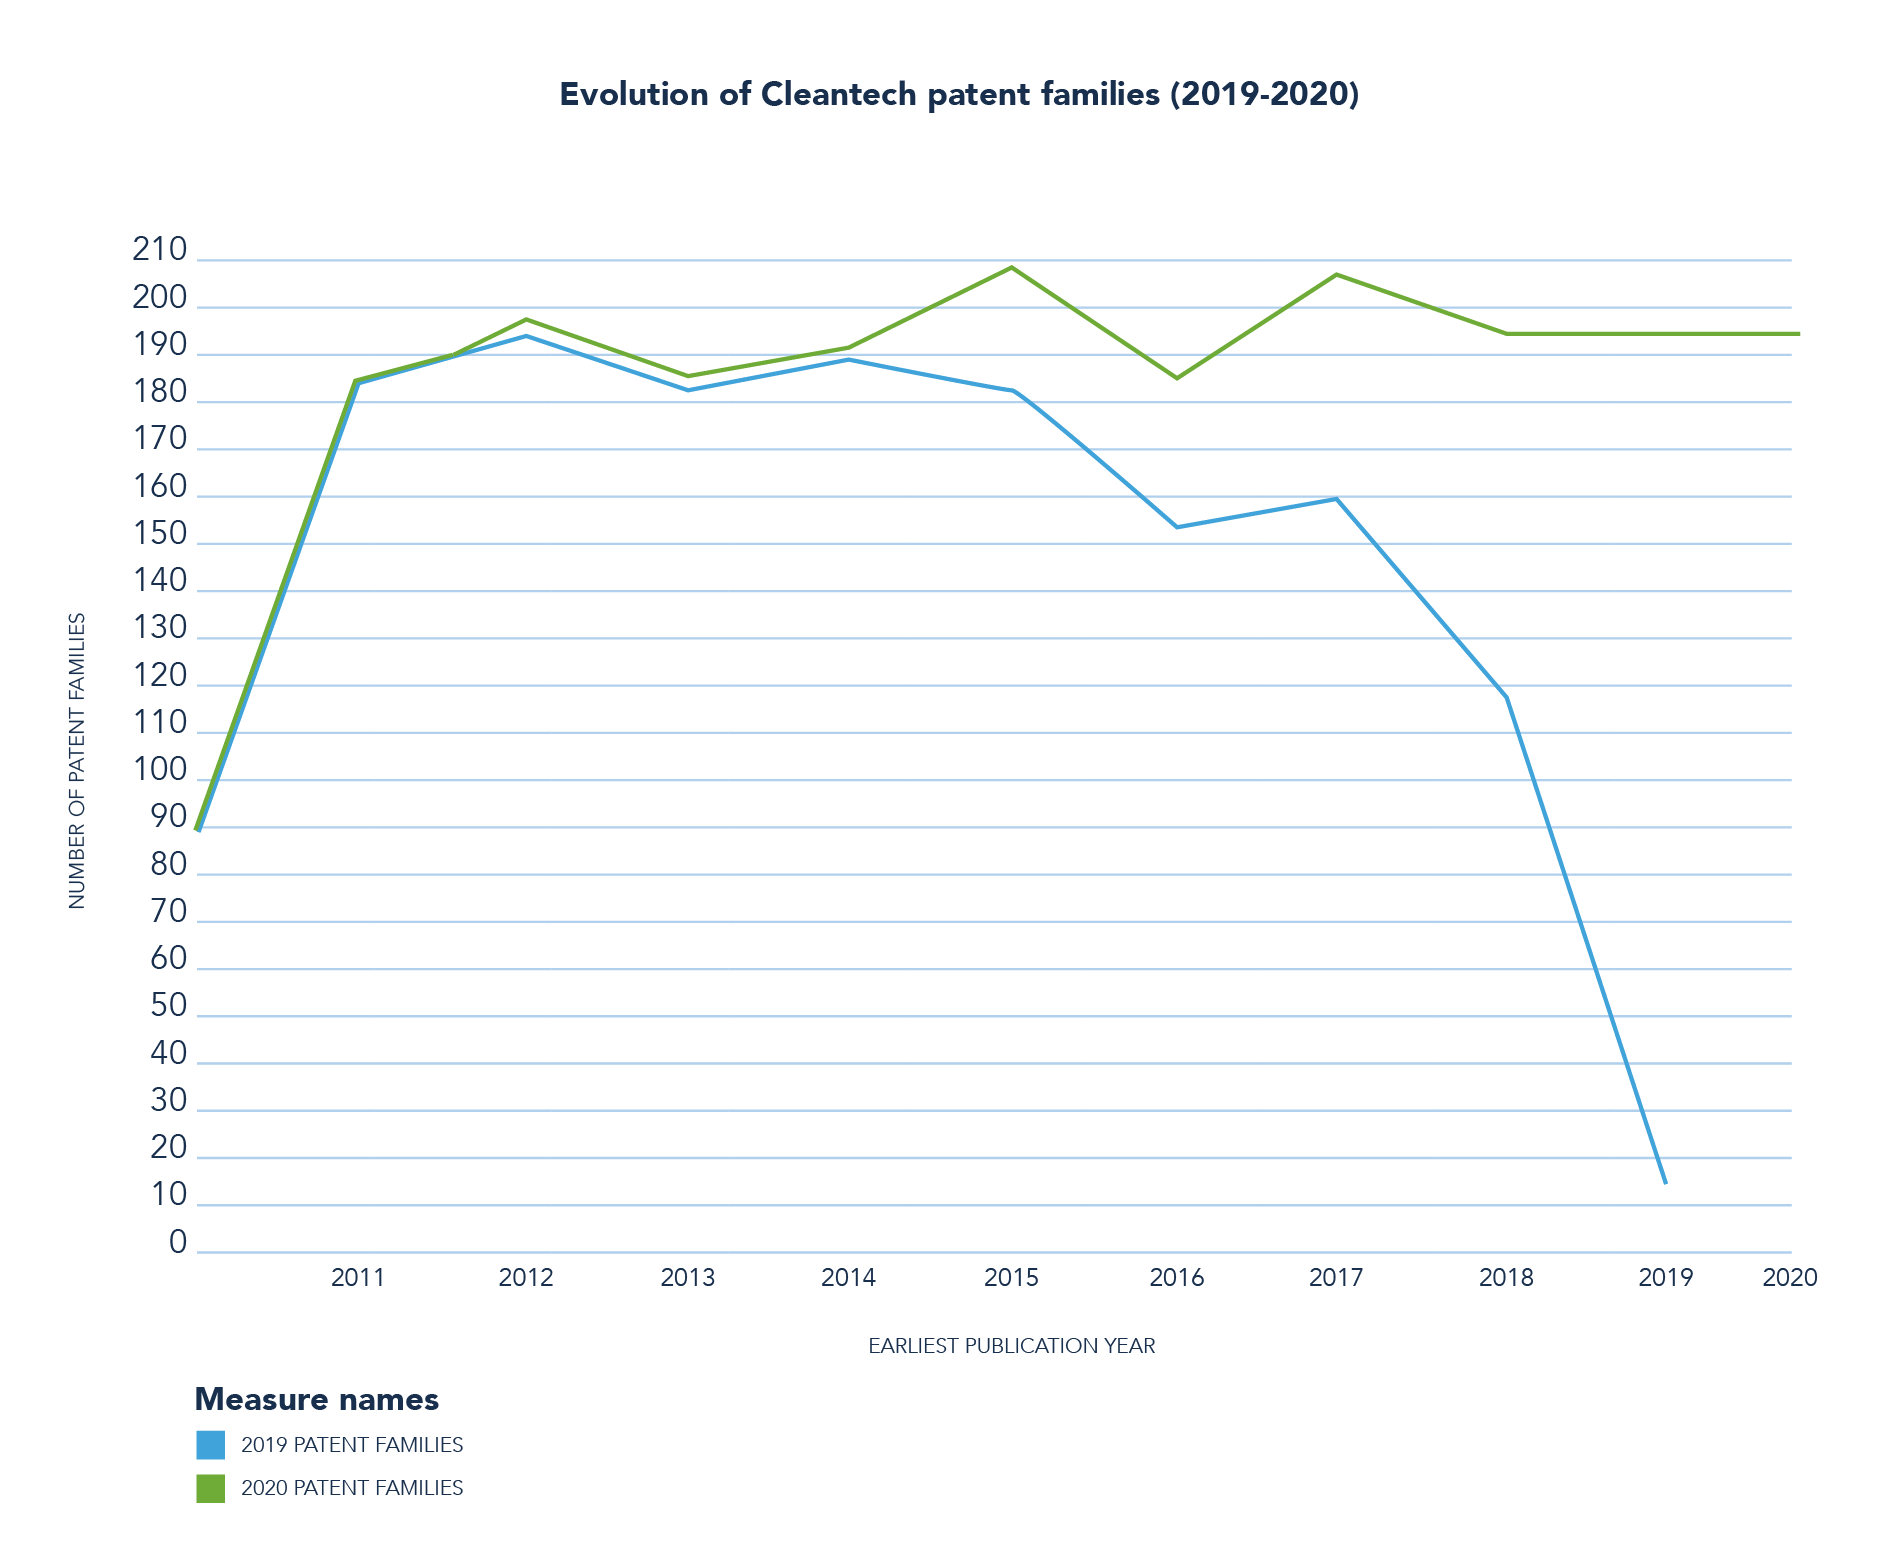
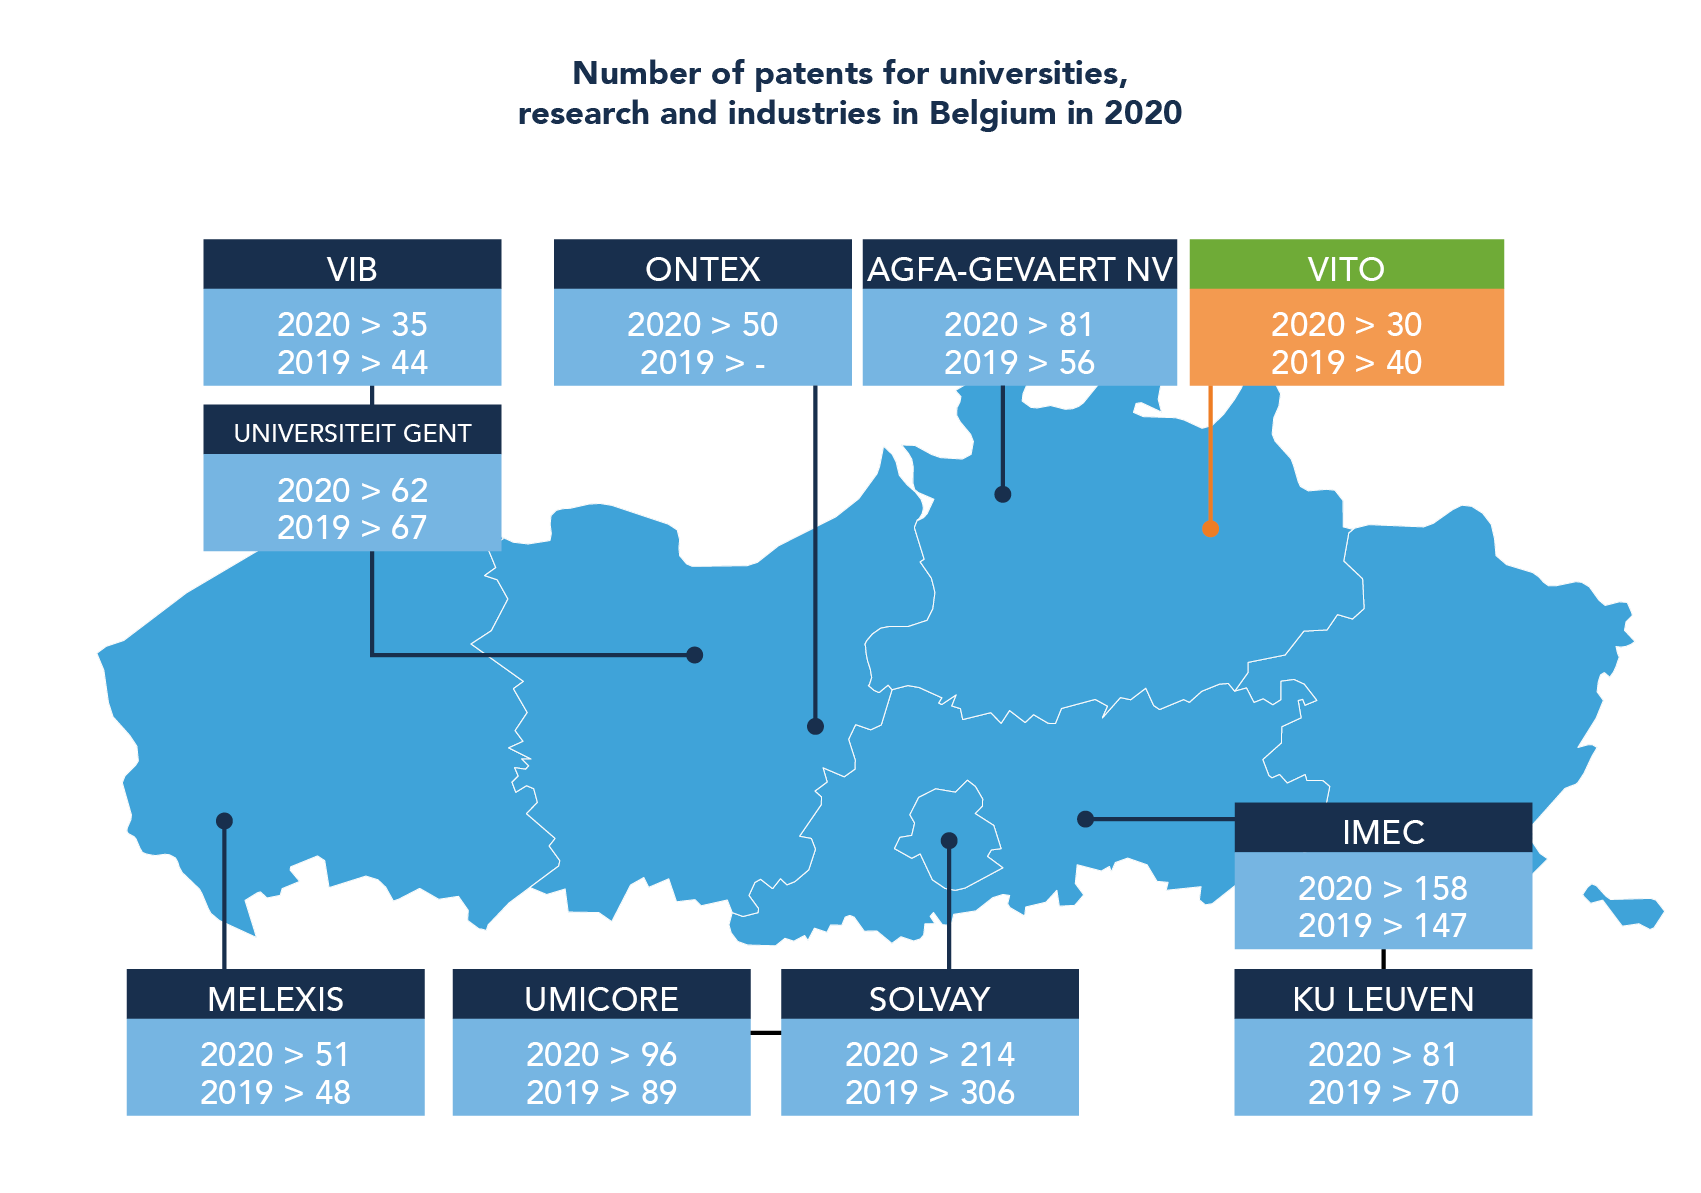
Innovation is difficult to quantify on an annual basis, given the lengthy patent process. This is evident from a comparison of the total number of annual patents over the past few years. From the 2018 versus 2019 data, we can conclude that a large batch of patents were approved in the past year that were applied for several years prior. Given this delay, it is clear that the number of patents for 2015 and beyond will increase as they are approved.
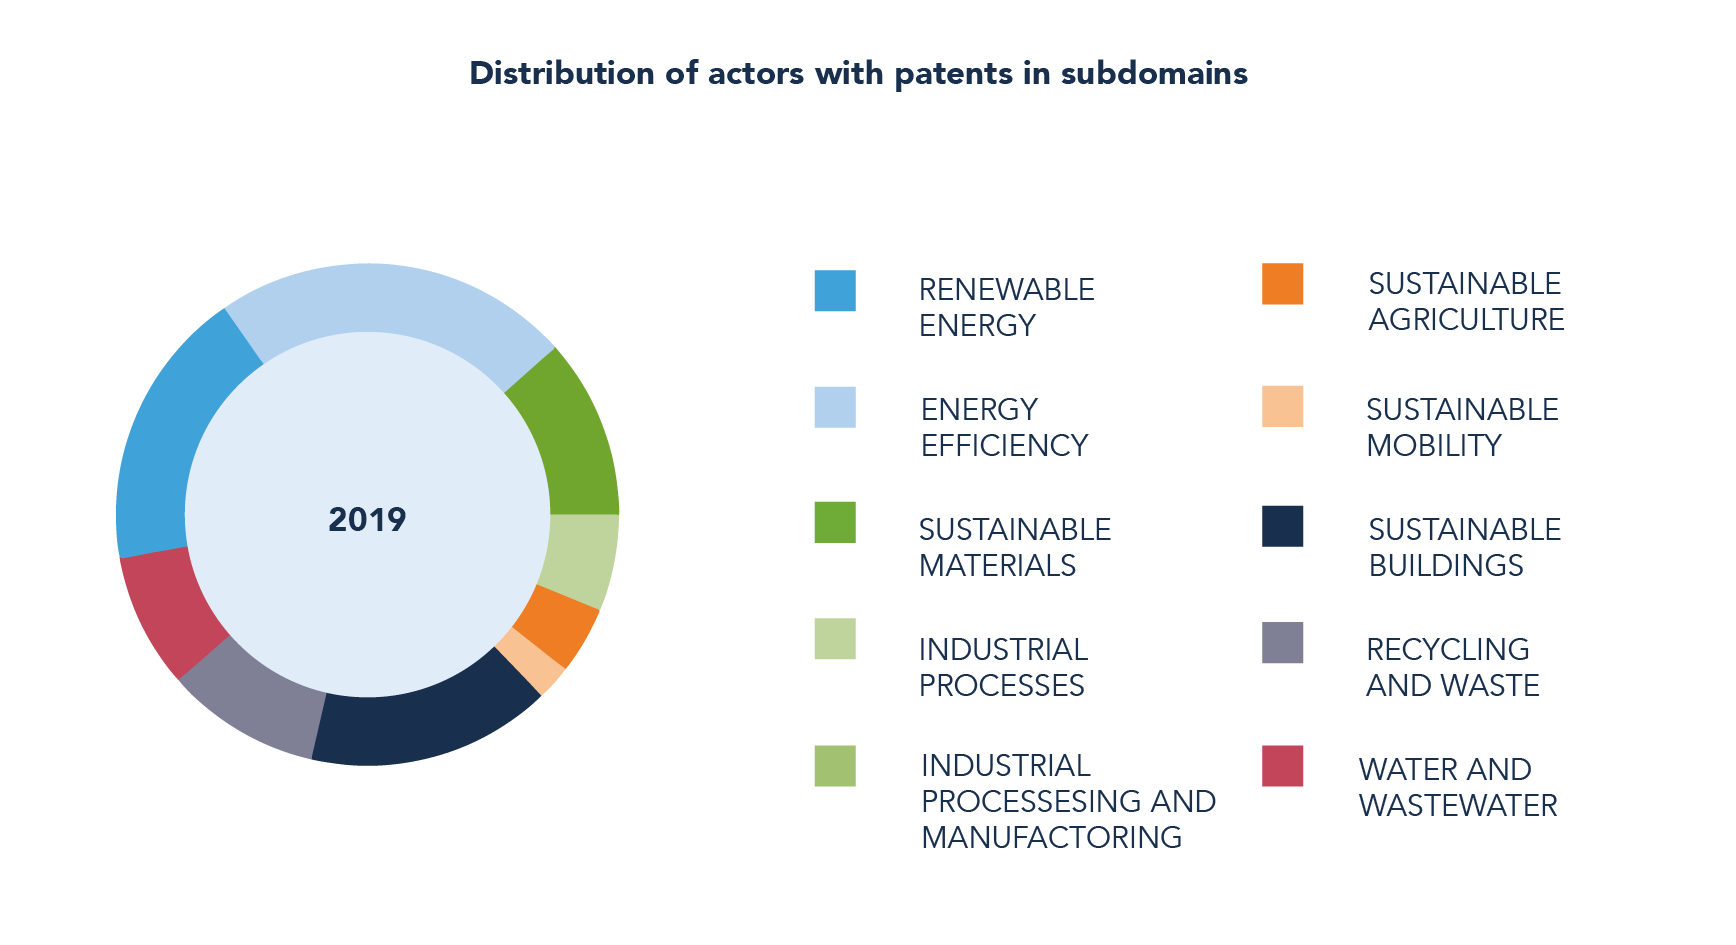
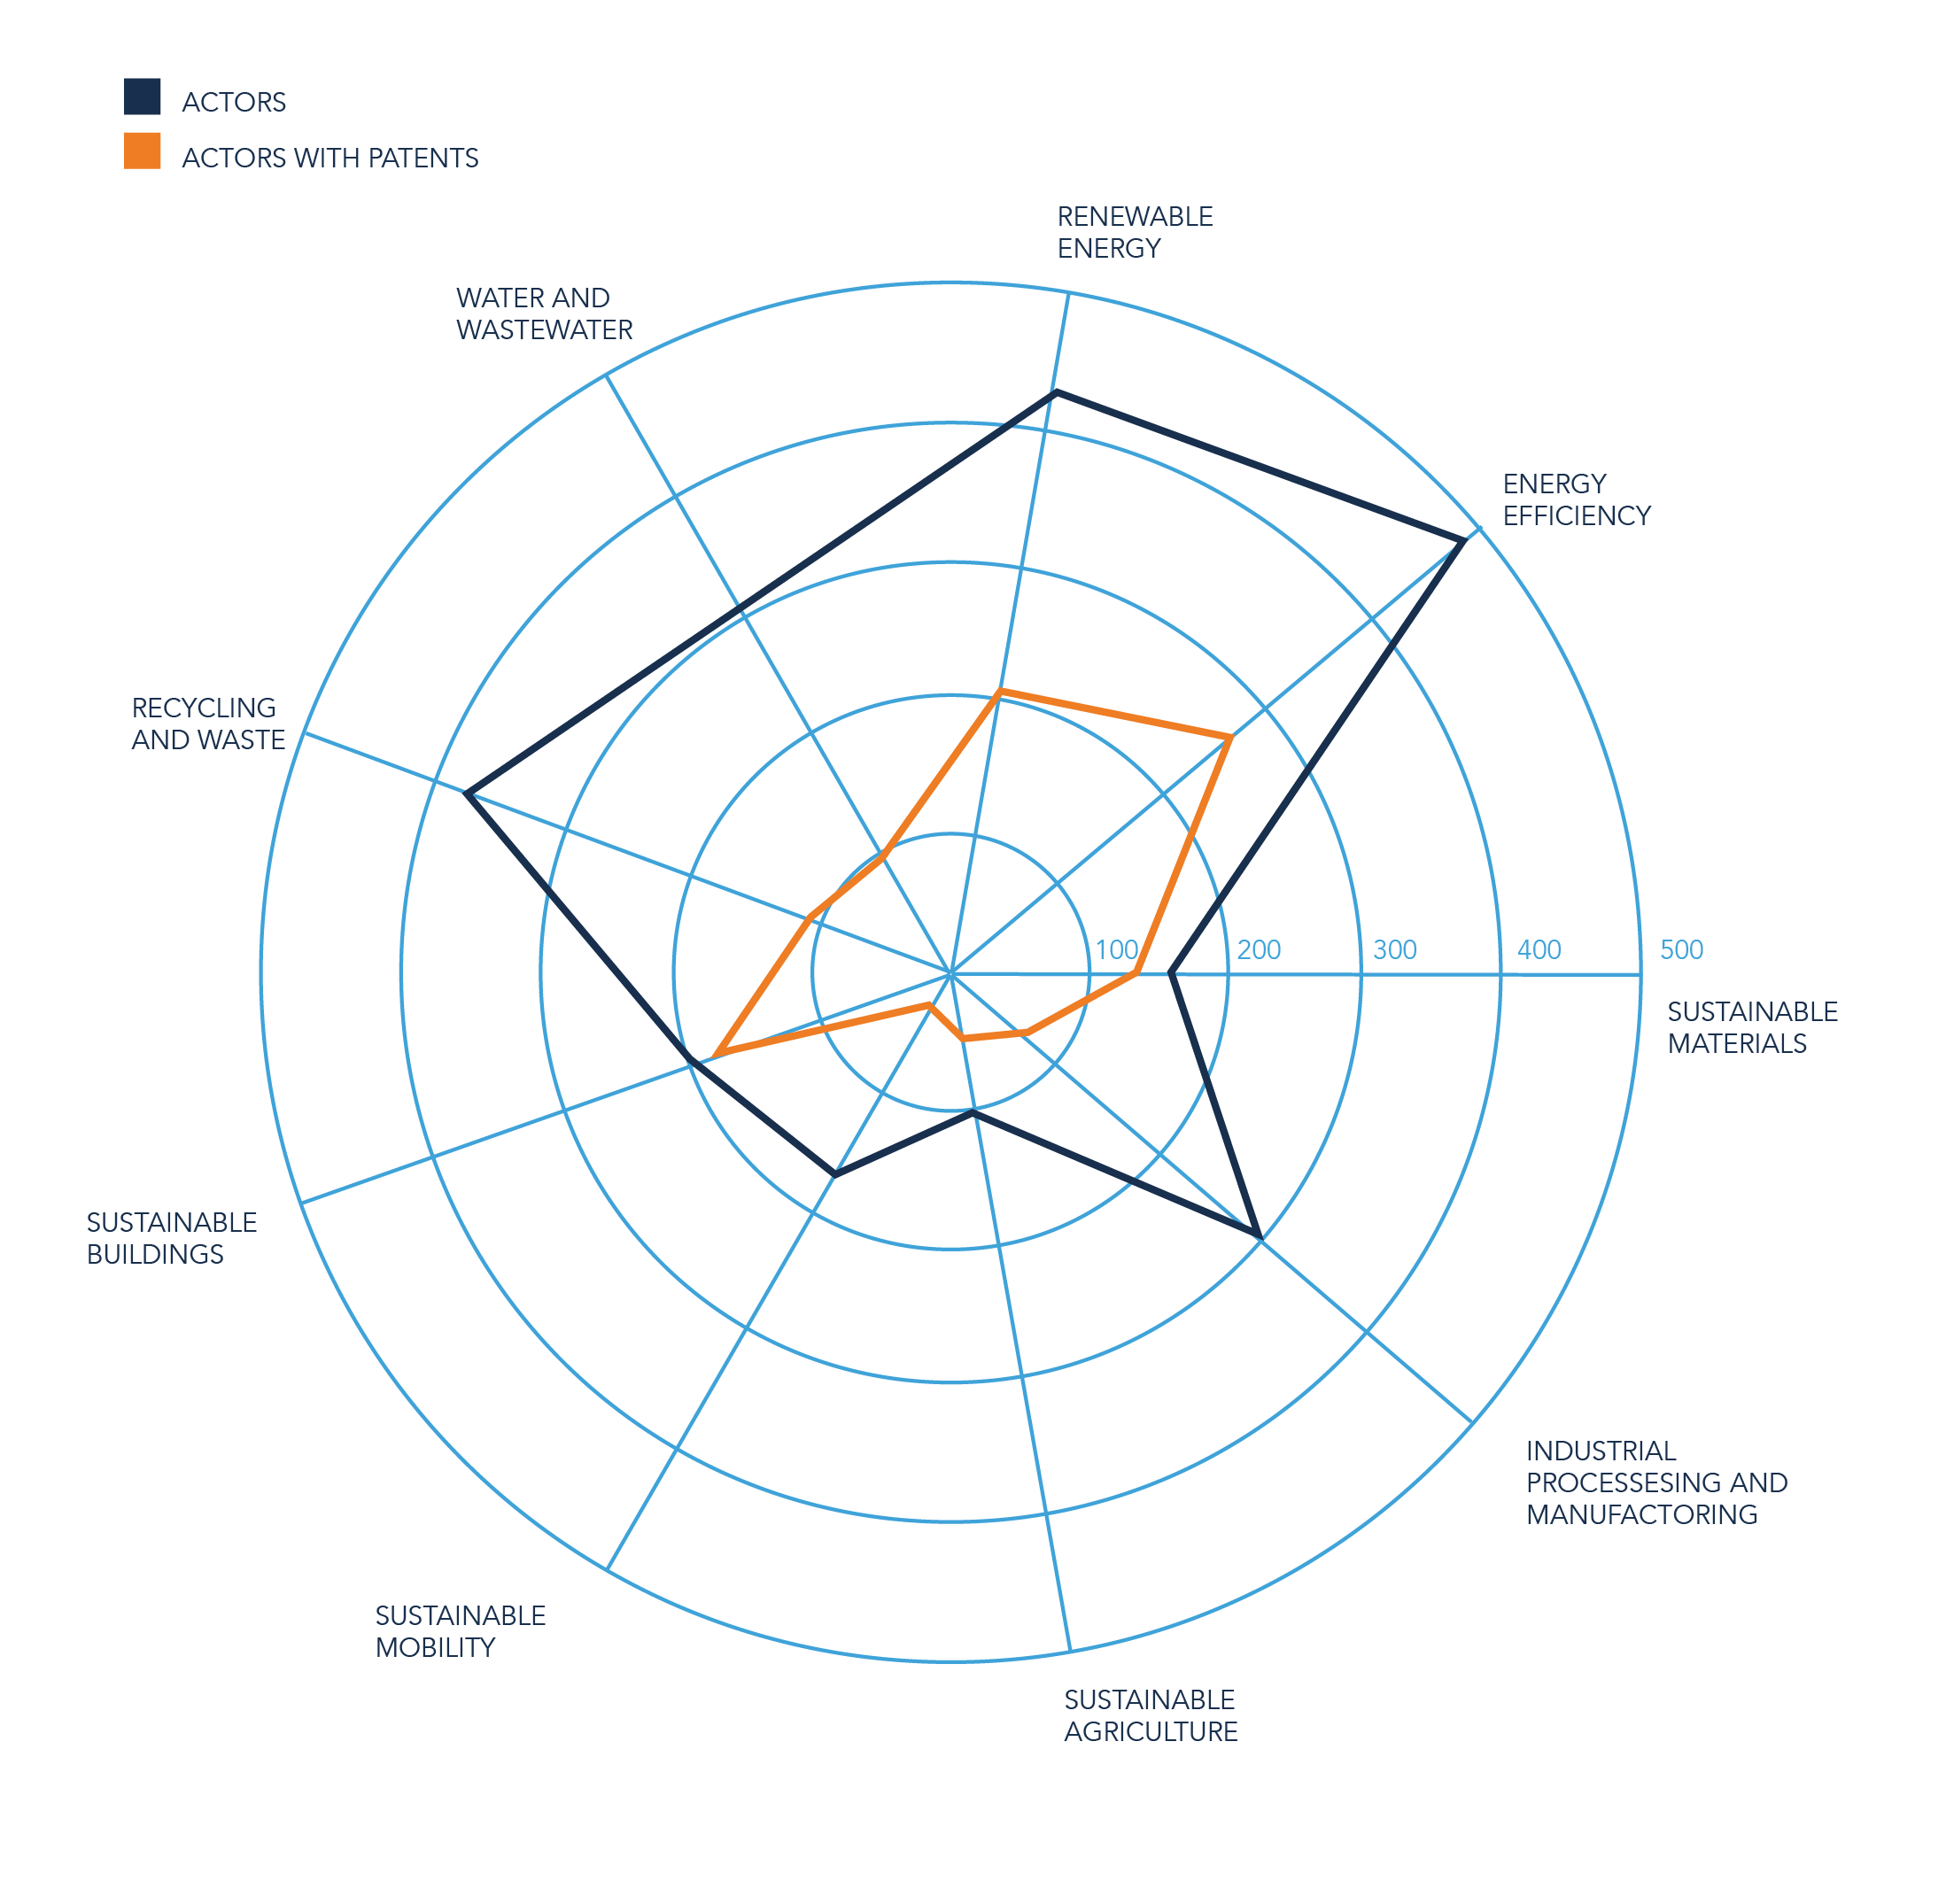
Comparing the cleantech stakeholders per field with the number of stakeholders that hold at least one patent illustrates that the fields with a longer history in cleantech rely less on innovation for their economic activities. Again, the field of sustainable buildings is illustrative of this, given the high number of companies that identify themselves as being active in both construction and cleantech who rely on innovation to distinguish themselves from the competition. Other fields, such as sustainable mobility, increasingly offer sustainable solutions without having developed these themselves and differentiate by, for example, offering a more streamlined sales process.
Companies who prioritise cleantech and sustainability appear to be particularly innovative compared to other companies. For example, it appears that 8 of the top 10 patent applicants in Flanders are active within cleantech.
Global cleantech trends
Globally, North America and Europe are still leading the way in the cleantech sector, with Asia following in third place.
The main trend is the increase in energy storage and the production of low-carbon hydrogen. Both are a consequence of the shift to renewable energy sources, which has driven the need for reliable energy storage and made renewable energy increasingly cheaper.
The renewable energy sector is experiencing continued growth, with more than 10 GW of wind power installations becoming functional by 2020. Solar energy continues to innovate, despite the drastic price drop for photovoltaic units.
The increase in sustainable mobility is less strong but continues, showing that the market for electric vehicles and shared cars has matured. Major investments are currently being made in making shipping and aviation more environmentally-friendly. Projects, such as Kawasaki Heavy Industries’ latest test in Australia in hydrogen liquefaction plants to export the fuel (in support of Japan’s vision of a hydrogen future) is just one example of the ongoing strategic developments in the sector.
Evolution of renewable energy in Flanders/Belgium
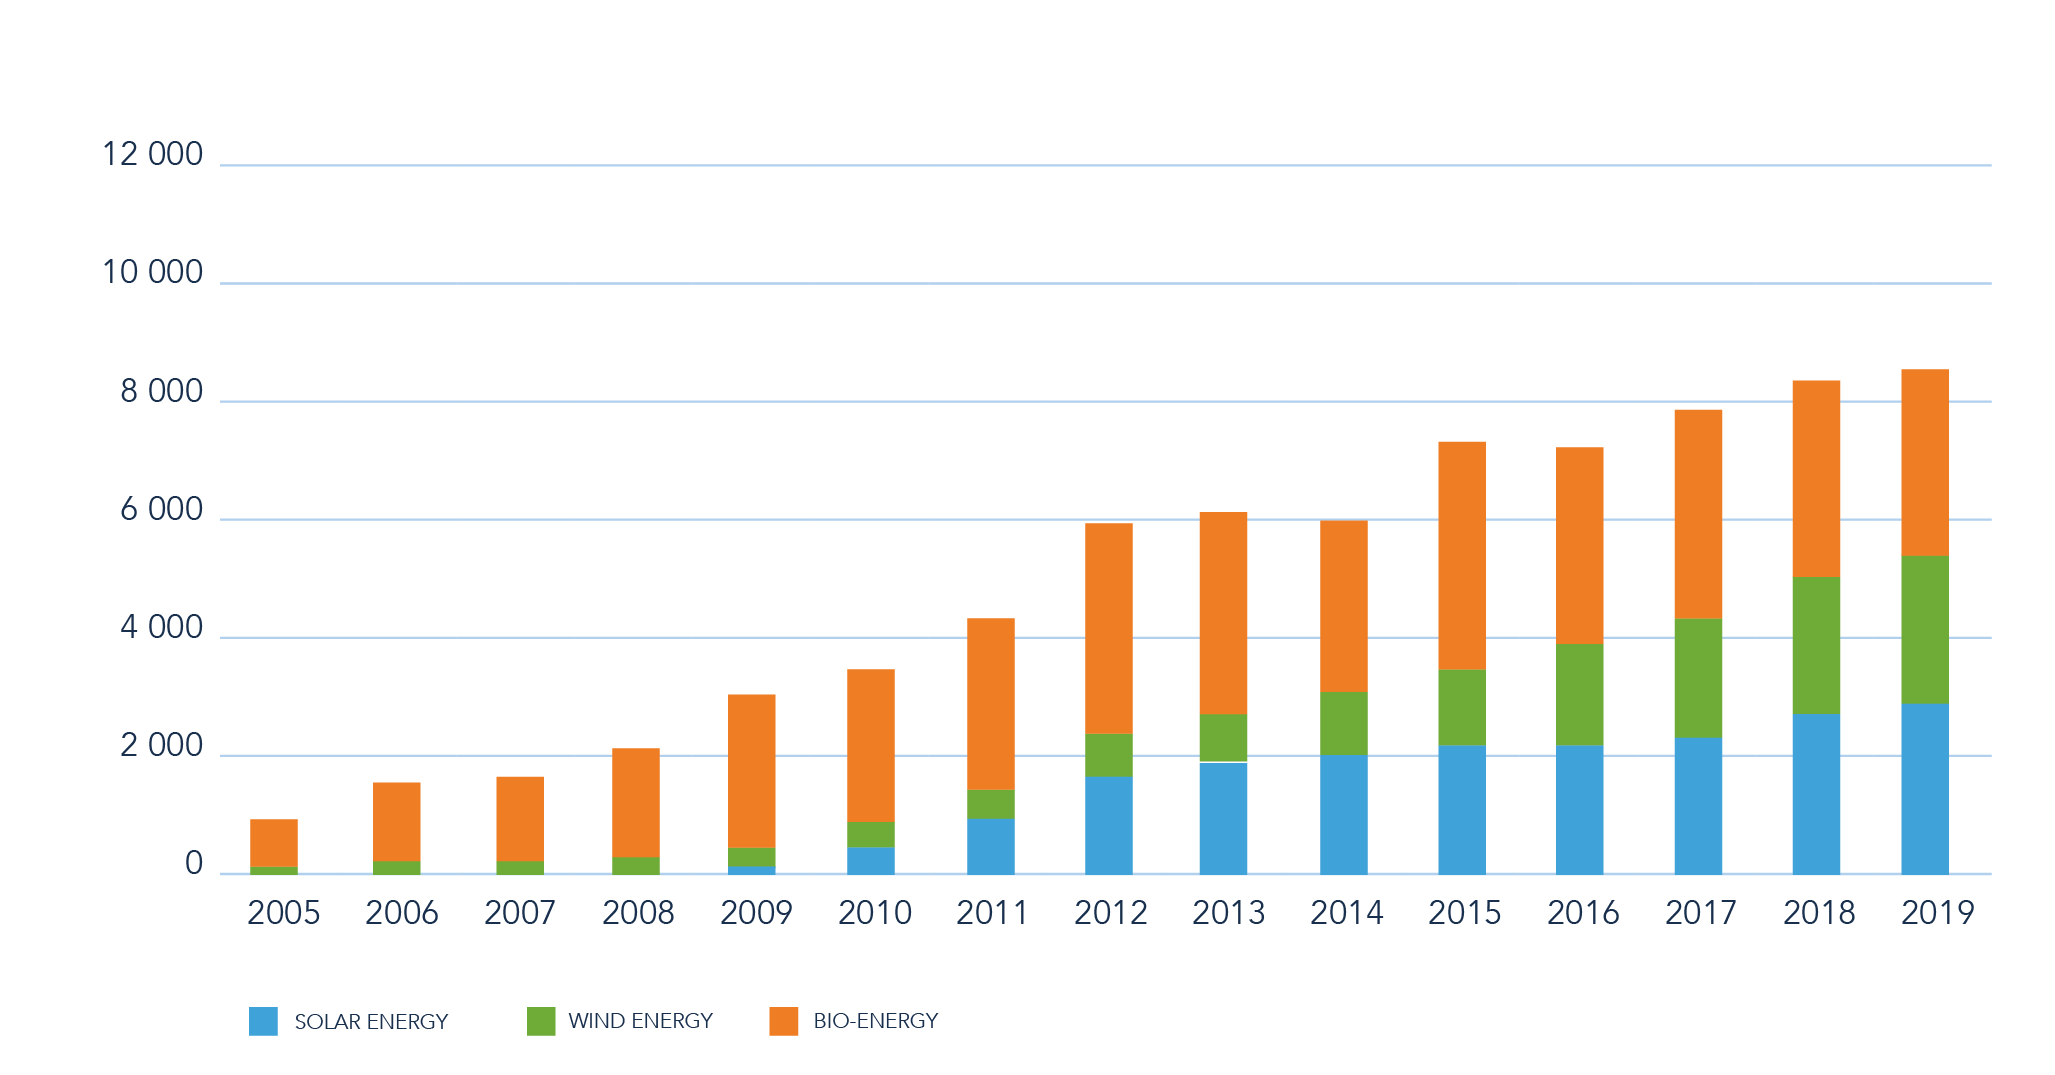
The share of renewable energy in the gross final energy consumption amounted to 7.2% in Flanders in 2019, whereas it was still 1.9% in 2005. This figure includes domestic production of green electricity, heat and cooling, but also the use of biofuels for transport, for example.Total gross green power generation in 2019 increased eightfold since 2005 to 8,680 gigawatt hours (GWh). The share of green electricity production in the Flemish gross electricity consumption was 14.6% in 2019.
The share of solar and wind energy in the production of green electricity is growing. New solar panels and wind turbines further increased the share of solar and wind energy in green electricity production from 15% in 2005 to 65% in 2019. Since 2016, more green power has been generated from solar and wind than from bioenergy.
Production based on biological material – biomass, biogas and the organic fraction of household waste (bioenergy) – accounted for 35% of green electricity production in 2019.
In 2019, according to the Flemish Energy Agency (VEA), 58250 installations were commissioned in Flanders, an increase of 13.2% compared to 2018. The distribution in terms of system size in 2019 is as follows, where the capacities listed by VEA are the inverter capacities (AC power, expressed in megawatts):
- smaller than 10 kilowatt: 57,530 solar panel installations, 220.66 megawatt (+10%)
- 10 to 40 kilowatt: 134 installations, 3.72 megawatt (- 5%)
- 40 to 250 kilowatt: 464 installations, 47.59 megawatt (+112%)
- 250 to 750 kilowatt: 100 installations, 50.63 megawatt (+287%)
- larger than 750 kilowatts: 22 installations, 92.81 megawatts (no systems >750 kilowatts were installed in 2018).
Source
www.statistiekvlaanderen.be/nl/hernieuwbare-energie
www.futech.be/nl/vlaamse-verkoopcijfers-zonnepanelen-2019-naar-boven-bijgesteld/

